I’m probably known best these days for my hardtail mountain and all-road bikes. What some may not know is that I have a long history riding and tuning suspension bikes and sport motorcycle. I’ve had big enduro bikes and downhill bikes. I’ve changed shims, fluid, and springs to alter the performance of these systems. This is the way.
As a framebuilder, I’m always a little tempted to produce a few bikes with rear suspension. My issue, generally, is whether I’d be getting as much value from them as the bother. Obviously, on trips to Whistler or Sedona, a suspension bike is the only real choice. On almost all of my local riding, not so much. Riding a hardtail or full rigid bike is just far more fun in most of the SF Bay area. I’m sure that this is true for most other folk in other areas as well.
Still, I do want. I have needs. I can’t ignore that. Toys are fun.
A few weeks ago, I did an insane interview with Adam Prosise. Adam is getting known as the go-to guy for suspension bits for the bike building world. That got my own wheels turning. I mention in that interview that I had fully modeled a pair of full suspension bikes in the last few years. The project scope and (just prior to 3D printing) the fabrication was going to be a major pain in the ass. Maybe it’s time to look at all that again.
Projects like this, for most and myself, tend to start with hours sitting in front of Linkage X3 software. This is an inexpensive and handy tool for folks looking to understand suspension kinematics in bicycles. The problem with the program is that it doesn’t really work in the ways a bike designer should expect. The way it handles bike geometry is strange and makes little sense. The interface and numerical inputs are course and awkward and difficult to use powerfully. I really can’t stand using the platform.
Here is an output from Linkage X3. Notice that the inputs for some of the various points are extremely course for this kind of work. It was impossible (I finally gave up) to get the bike geometry to be reported correctly. There is no need to trust anything but the rear kinematics.
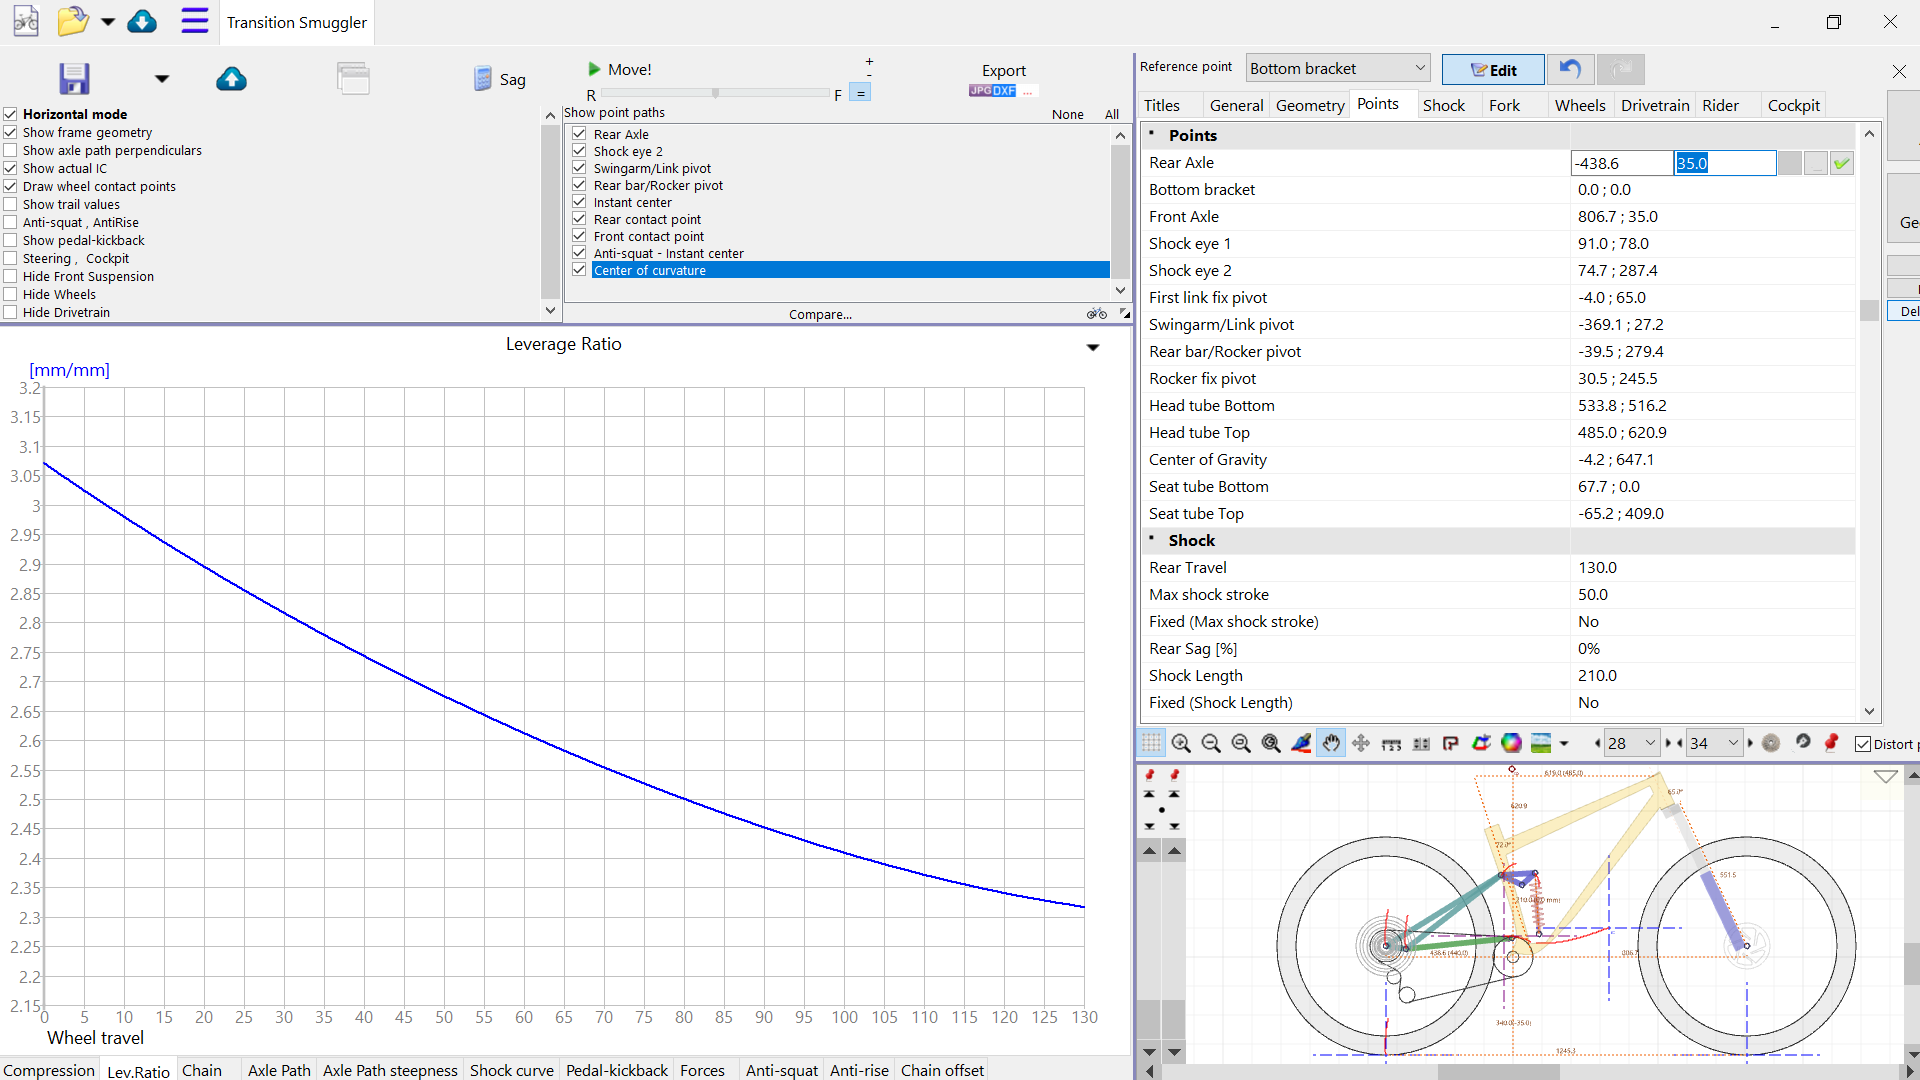
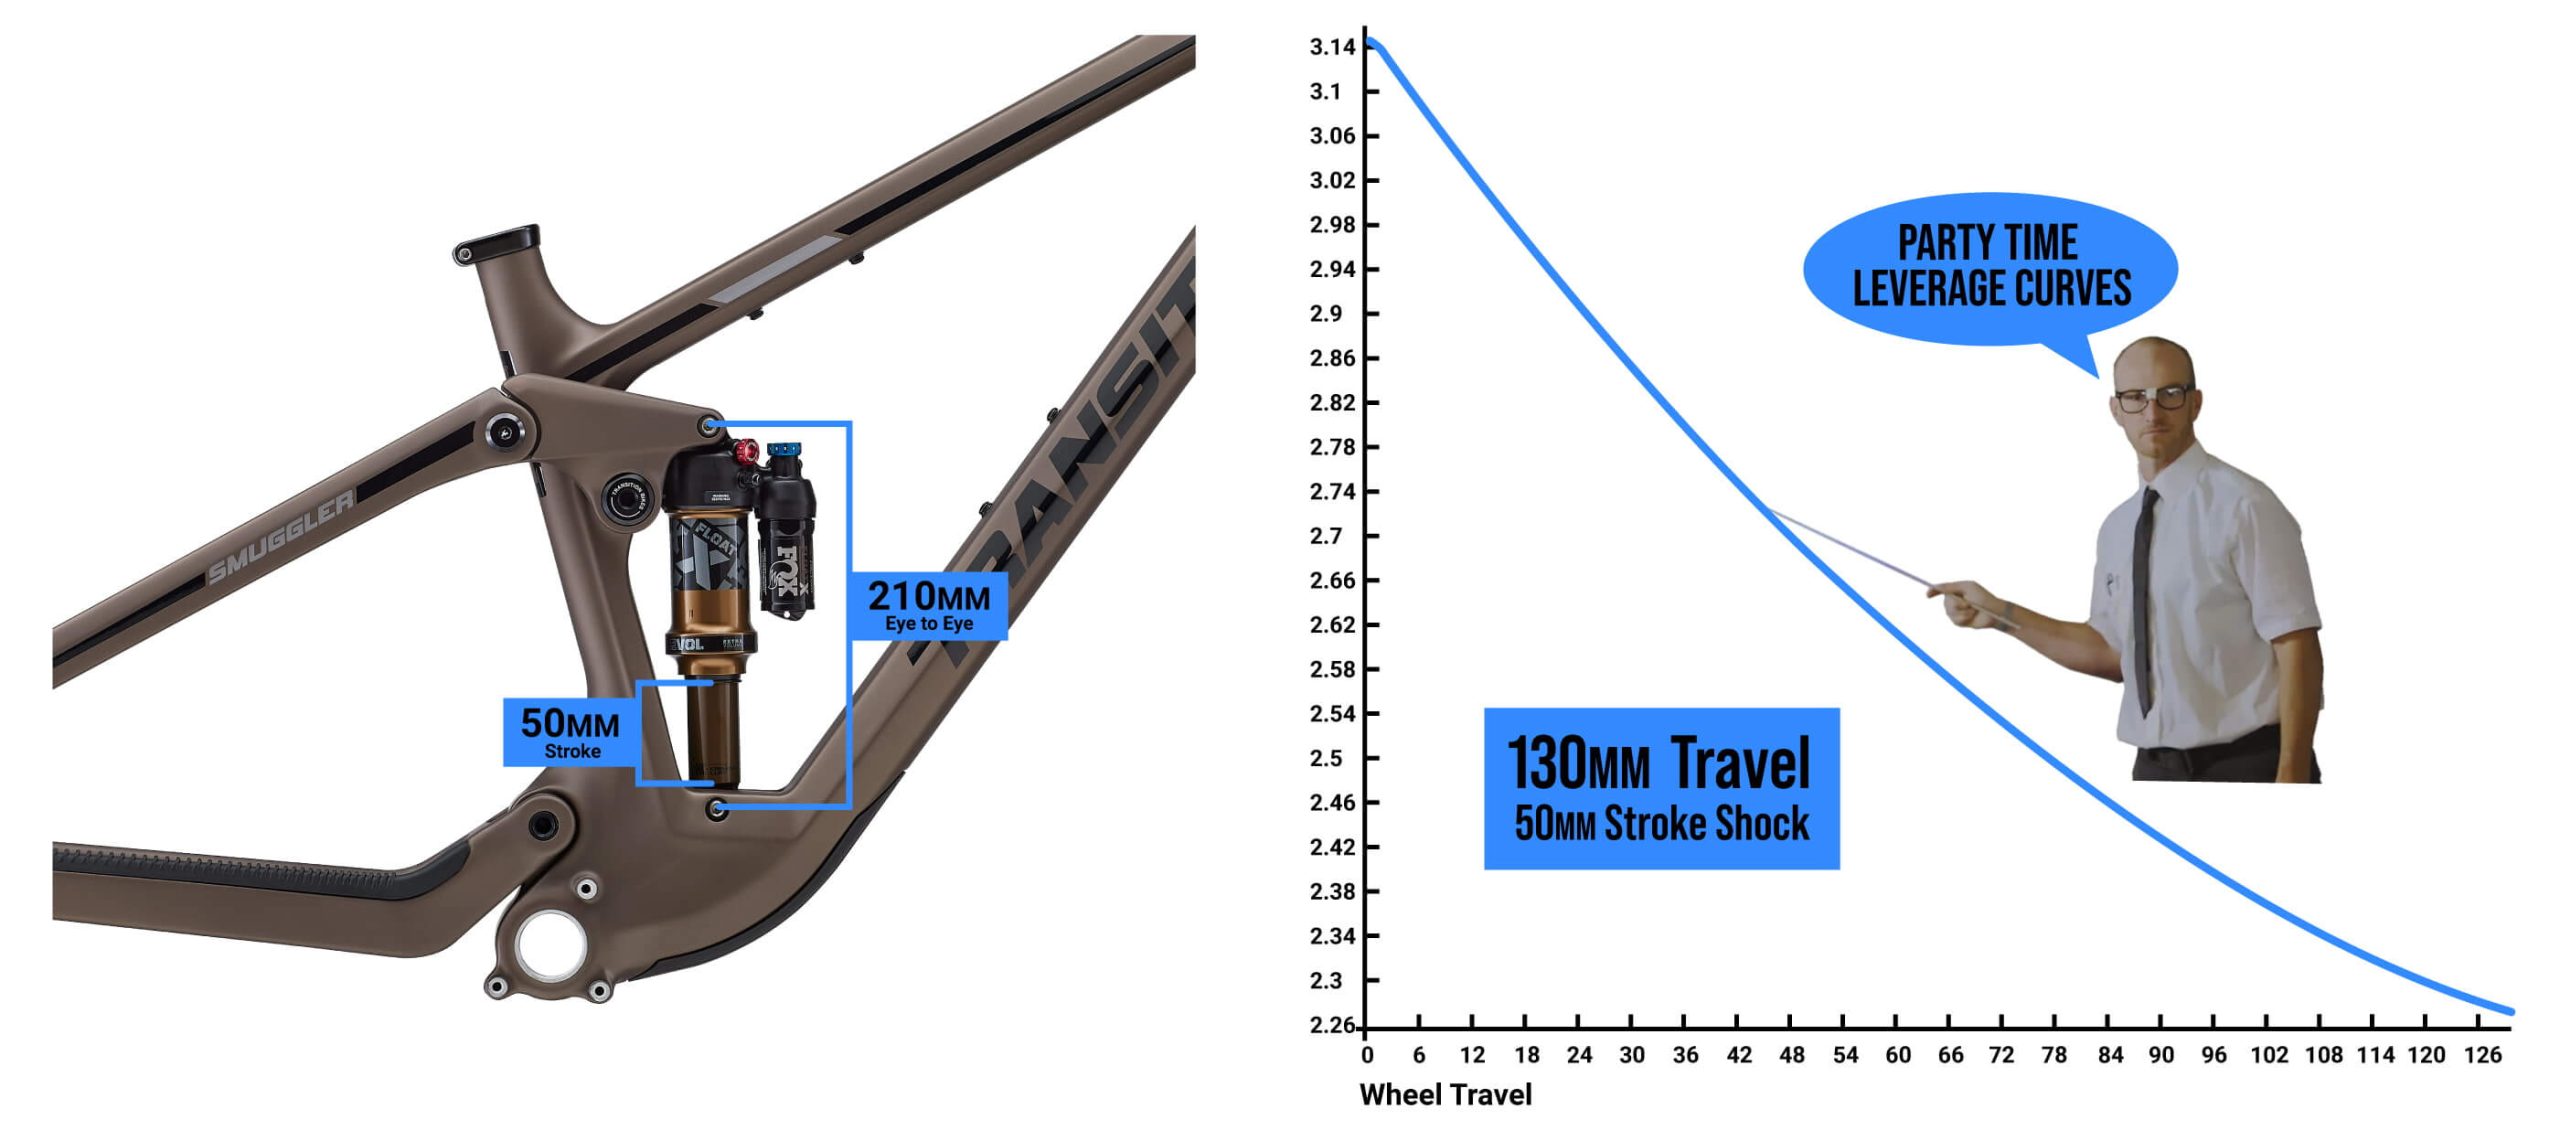
We see right away that this doesn’t match the marketing material provided by Transition for this bike. Clearly, they don’t take this part of the design as seriously as others. I’ve tried to solve this several ways and I keep getting 3.06 as a peak leverage ratio, not 3.15. This doesn’t really matter much on the trail but you would expect reported values to reflect some kind of fact.
So when I started thinking about all this (once again). I decided that I’d just build out my own calculation set. Then I could control everything exactly as I want. Don’t ask the scorpion to not be a scorpion.
To be clear, I have done motion studies inside Solidworks for many years. While this is certainly the way to go to build data sets from very complex mechanisms that are explored deeply but infrequently I don’t belive that doing so for long time bike geeks makes sense. Why? For one, the data set is generally very limited and delt with in they typical ham-fisted SolidWorks way. Getting a set that can be explored in as granular a way as needed is nice. Also, we will end up in Excel to produce graphs or outputs regardless of the internal features in SolidWorks. More, There are only a few types of kinematic systems used for most designs, and rarely more than one in a production setting. Why not just build a proper tool? Lastly and most importantly, spreadsheet calculations are vastly quicker and more precise than anything that a motion study is going to produce.
Building out this calculation is not trivial work. It’s a lot of high school math. Far more than most are able or willing to do. But I do what I do. I like nice tools. Sometimes, you make them.
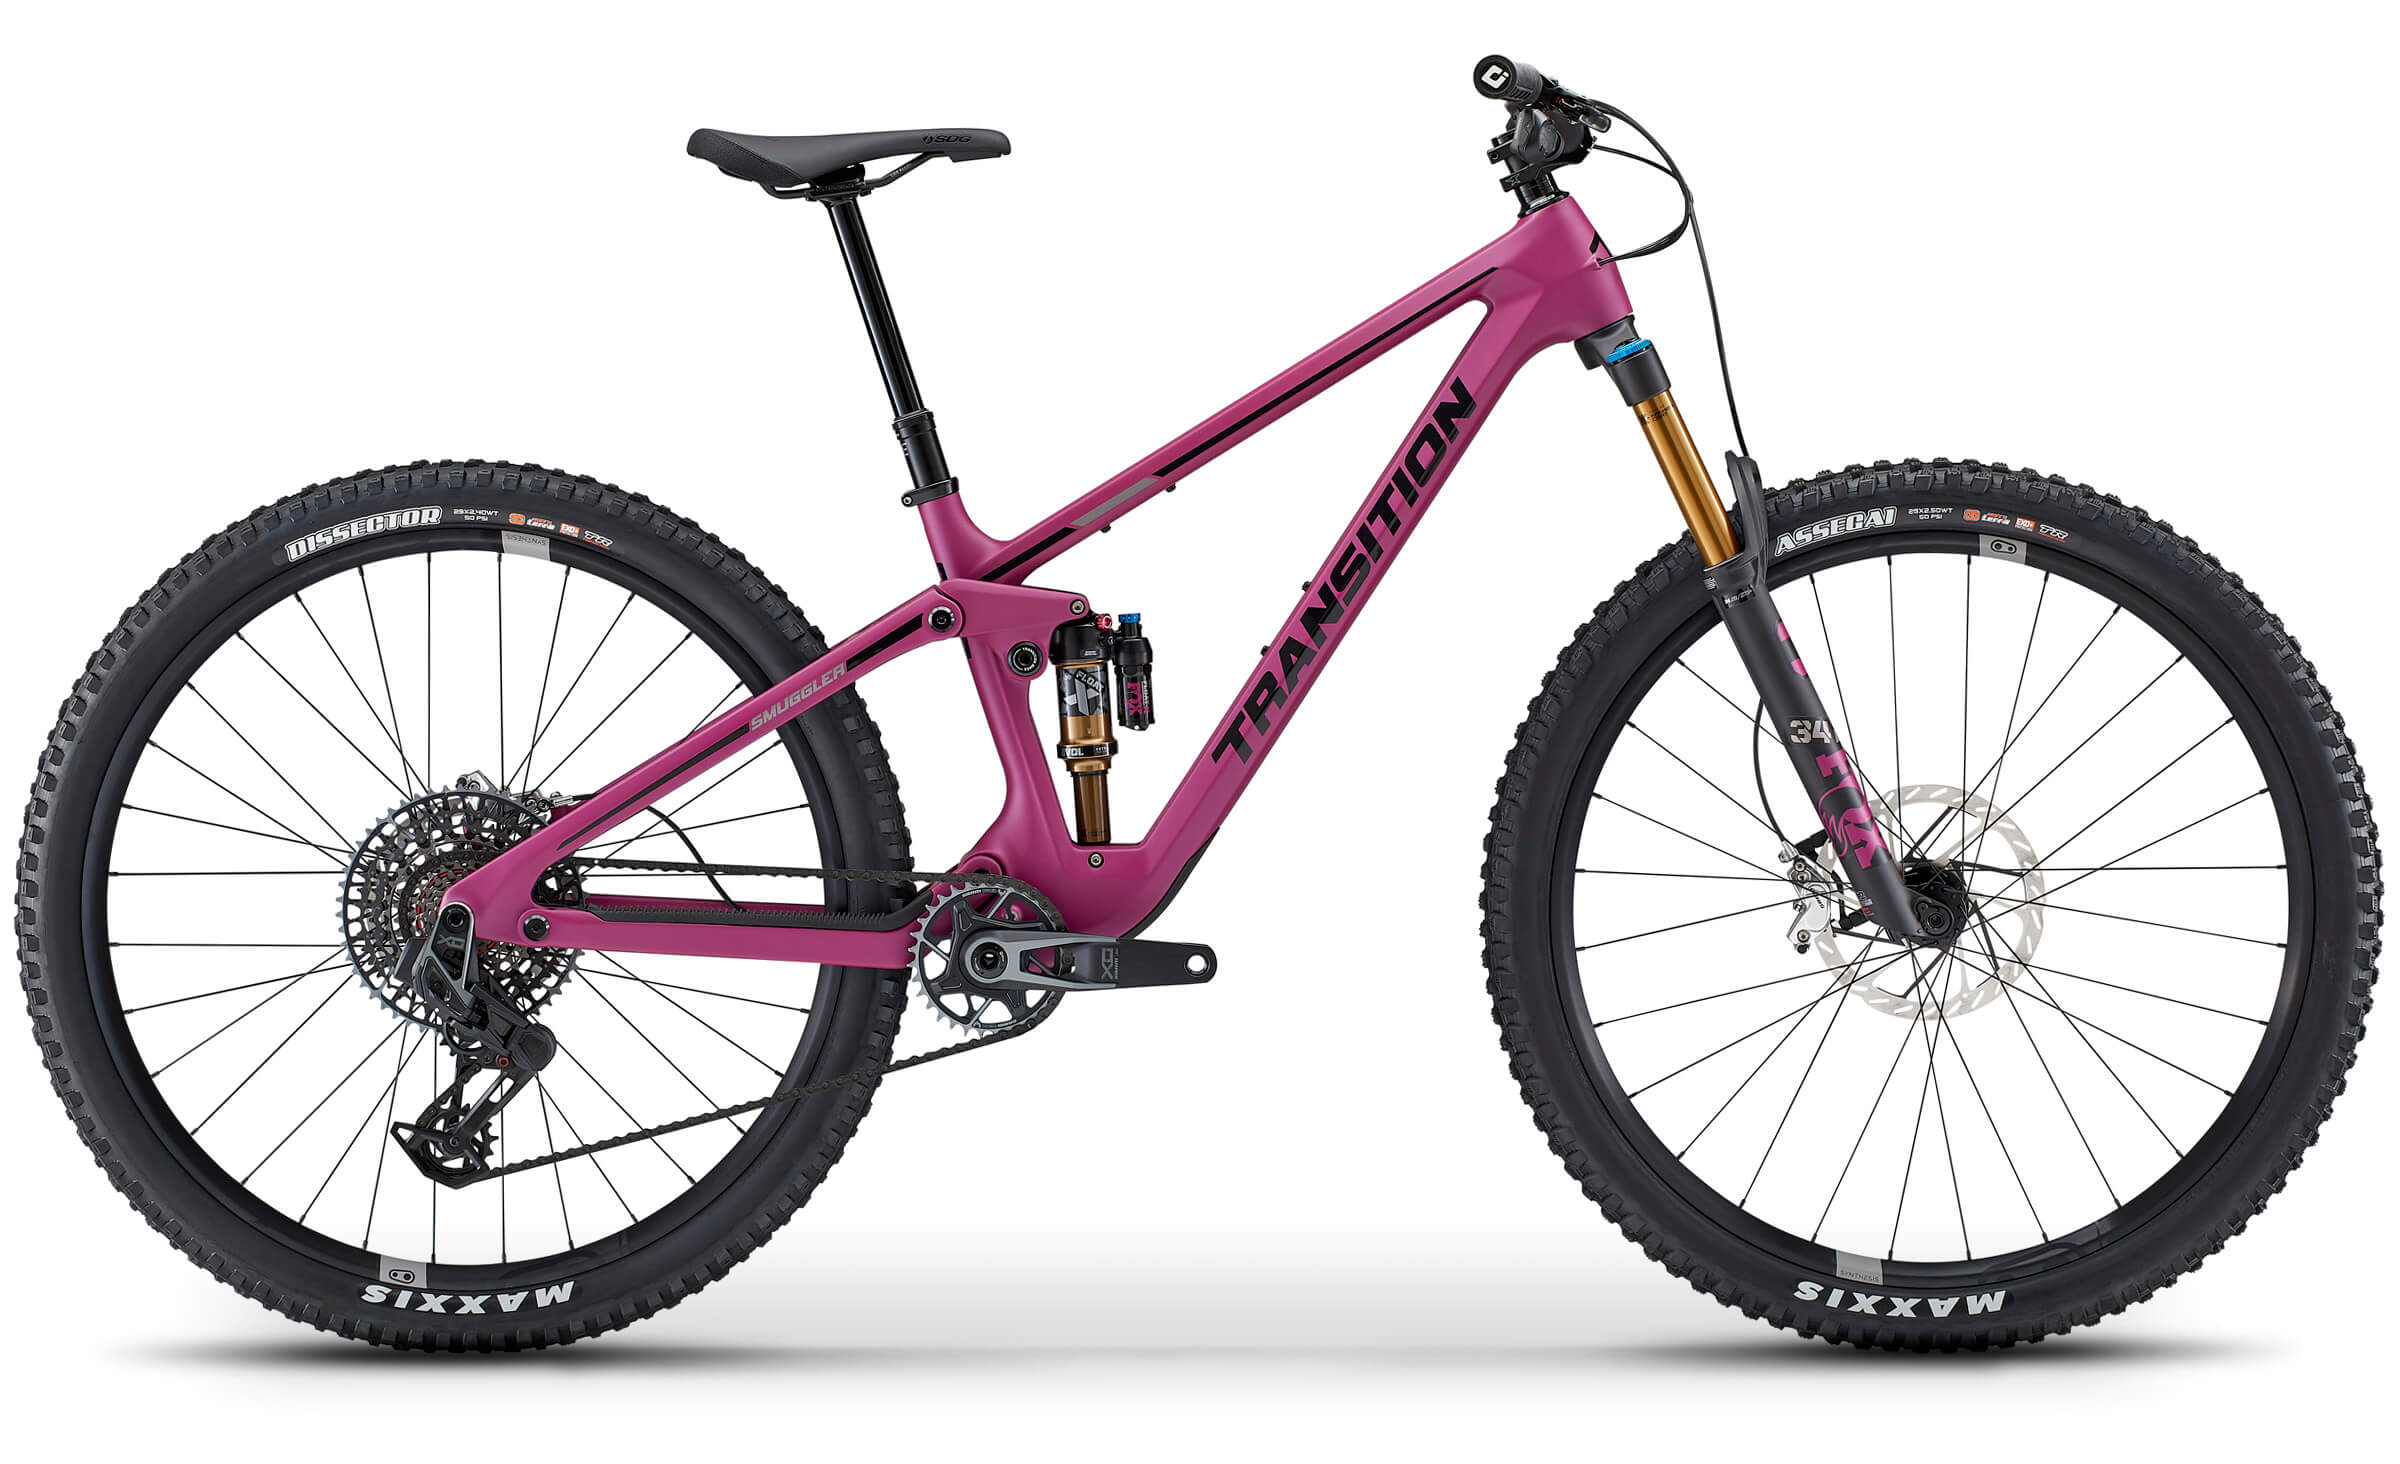
I went on to prove a method of calculating rear wheel position numerically through the suspension travel for a basic FSR system. Not because I’m championing that system but because it’s common and I have plenty of references easy to me. An FSR is numerically identical to just about every other 4-bar system and shock layout. The number change. The results change. The math doesn’t. Since the new 2023 Transition Smuggler had just come out and Split Rock had a size large sitting on the floor, I used that for actual values in the spreadsheet. It’s nice to have something real to measure work against.
Acquiring real numbers for a bike is always a problem. They tend not to be published or available in any way. I don’t have a CMM, let alone one that I can bring into a bike shop with me. So, I took actual measures from the bike with common tools. Then I idealized the values to fit correctly within a theoretical system that matched the published data. My goal here is to prove a system, not completely reverse engineer the Transitions product.
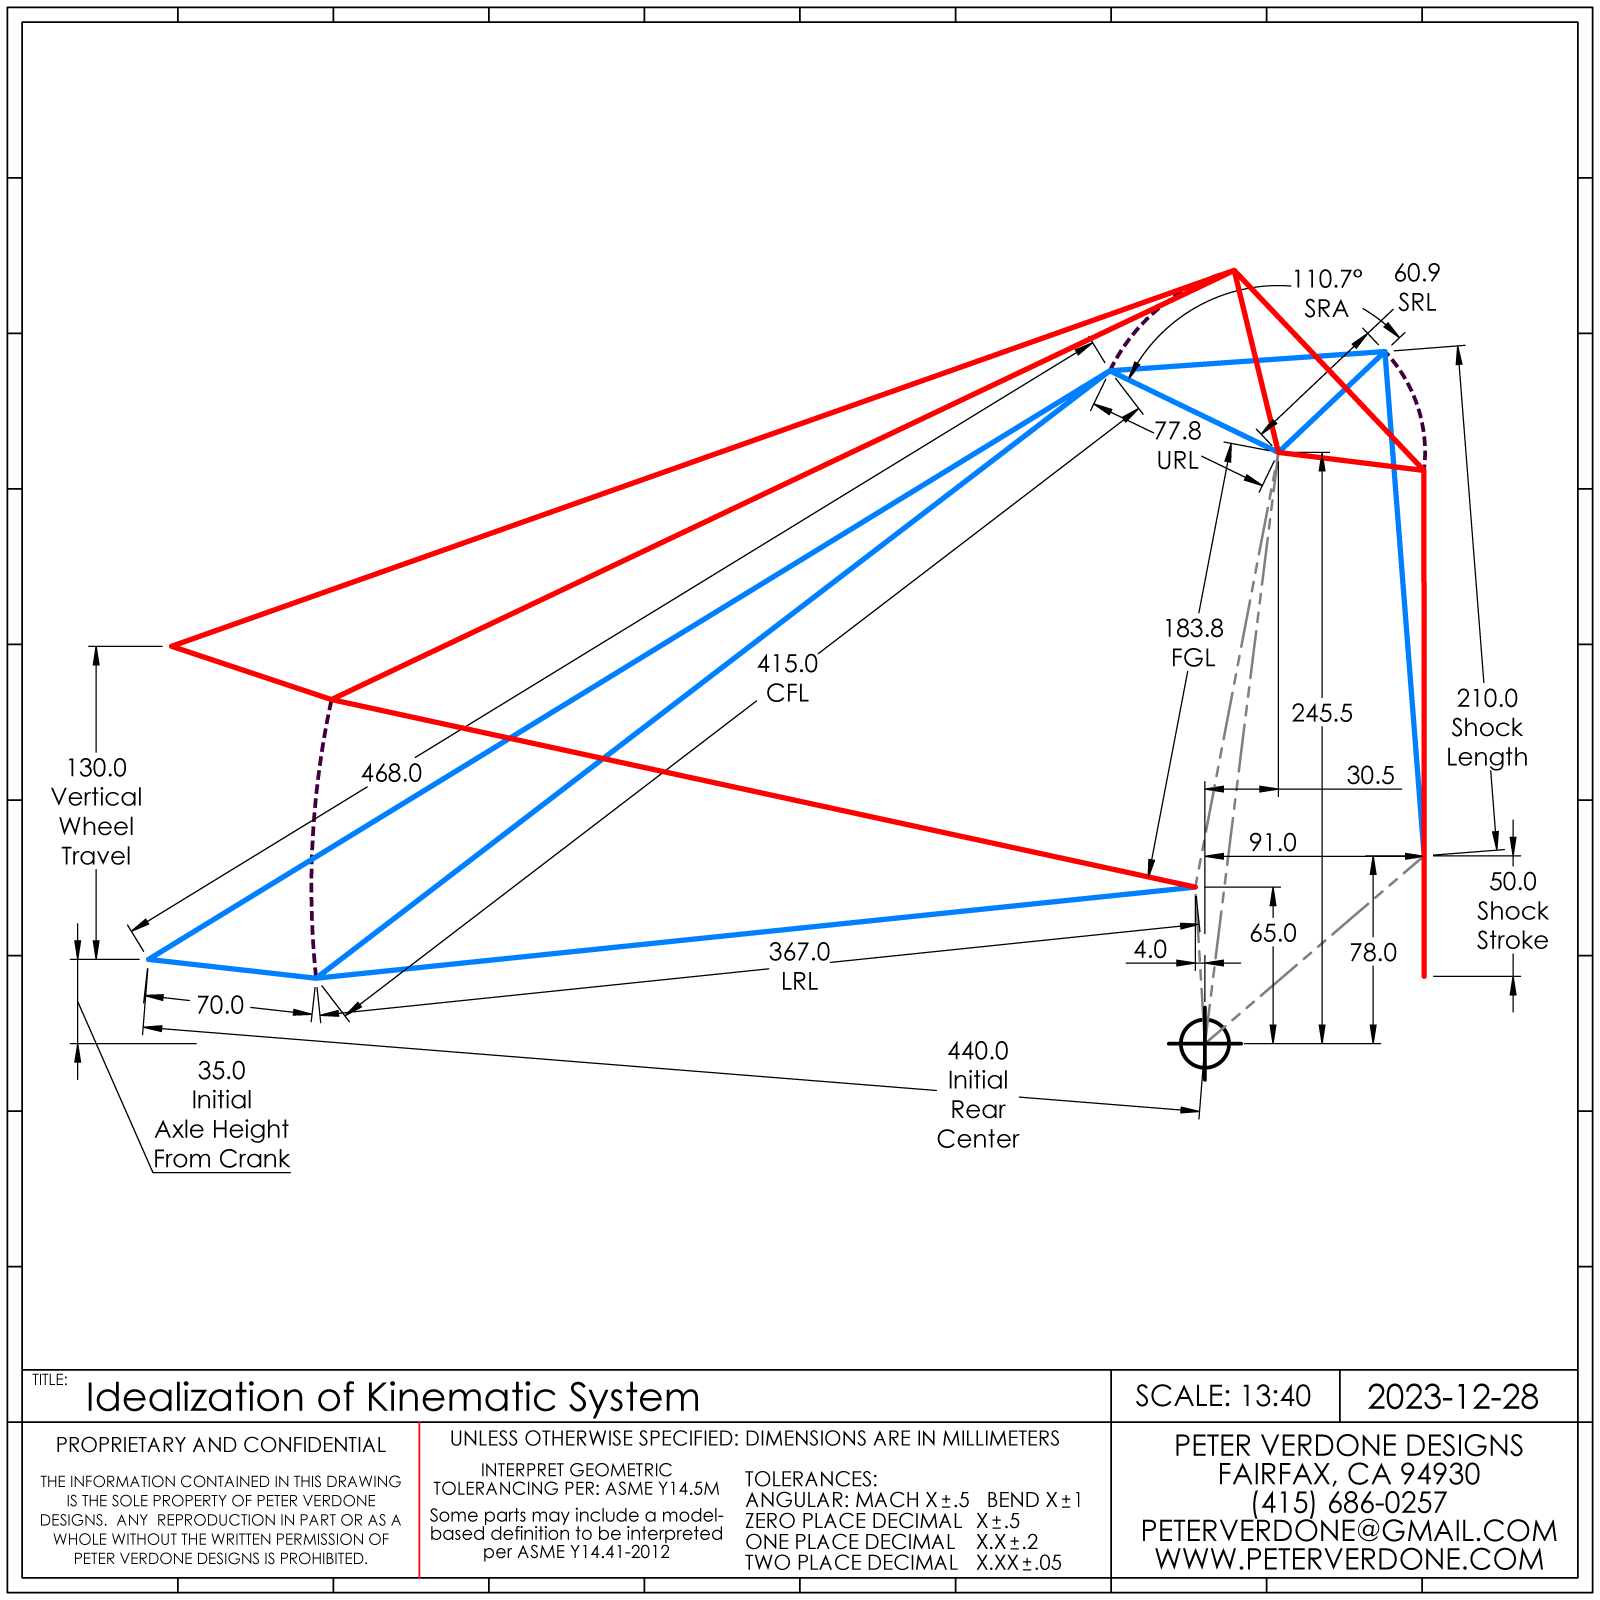
Something that I’m continuing to work on is naming of the parts of the system. These documents may show differing states of that development. For consistency between the several systems, let’s call the part connected to the axle the coupler/floating Link (CFL). For a simple system, this will be connected directly to the frame and probably an upper rocking link (URL). For a FSR or any other type of virtual pivot design, there will be at least one lower rocker link (LRL). The two points that connect to the frame form another fixed link, the frame ground link (FGL) Here, the rocker/bell crank is part of the upper link. So, we have a shock rocker angle (SRA) and a shock rocker link (SRL) There could be another pushrod or link connected to the upper link and the shock but we will skip that for now.
Then there is the description of where on a part is being described. Generally, there will be a chassis side, a shock side, and a wheel side. This gets tricky so bear with me while this develops. I’m also open for input from folks that have worked this out already.
![]()
There are some basic vectors that can come from this. These won’t change as they are fixed to the chassis or built into the swinging arm.
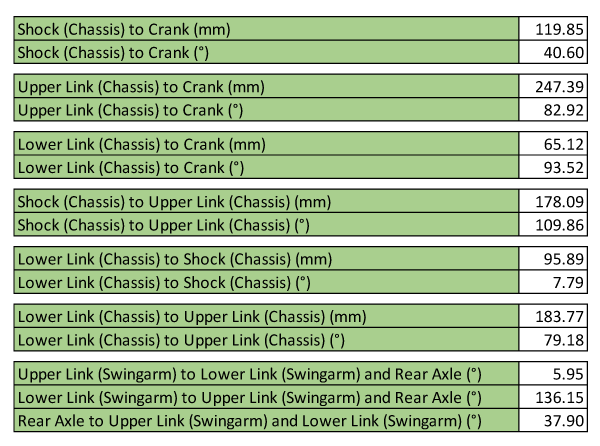
The data is then processed through the calculator to produce rear wheel coordinates at specific intervals of the shock stroke. In bicycles, and other similar systems, the shock is what will define the initial and final positions of the rear wheel so we drive from there. I chose to add a few other values that are quickly derived.
Here is the table for the shock from 0.0mm to 5.0mm. It continues to 50mm to match the shock stroke.
![]()
Graphically, that data can be shown easily.
![]()
Folks tend to want to understand the leverage ratio of the system. That is shown below, both types; vertical and absolute. This differs from what Transition shows in their ad copy. I’d like to have an optimistic explanation for that.
![]()
![]()
Geometrically, we can see how the wheel moves first rearward and then forward as the suspension is cycled. This is pretty helpful to understand the lateral path of the wheel.
![]()
The rear center radius changes in a much greater way through the travel than lateral component. I don’t believe that linkage will output a graph like this.
![]()
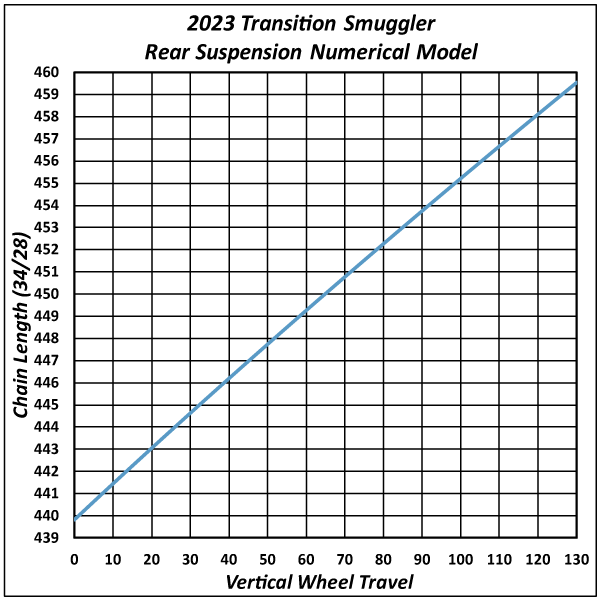
Chain length is interesting. It’s the length of the chain between the two sprockets on the top side. Now we are starting to get into the kind of information that effects pedaling performance and power transfer into driving the bicycle forward.
![]()
This is all expandable so that we are able to calculate other important properties of the system, like; anti-squat angle, pedal kickback, brake jack, and others. I’m not going to bother doing that here as it starts turning into a real mess with differing gearing, riders, and front end geometries. That will come if I really do end up making the bike.
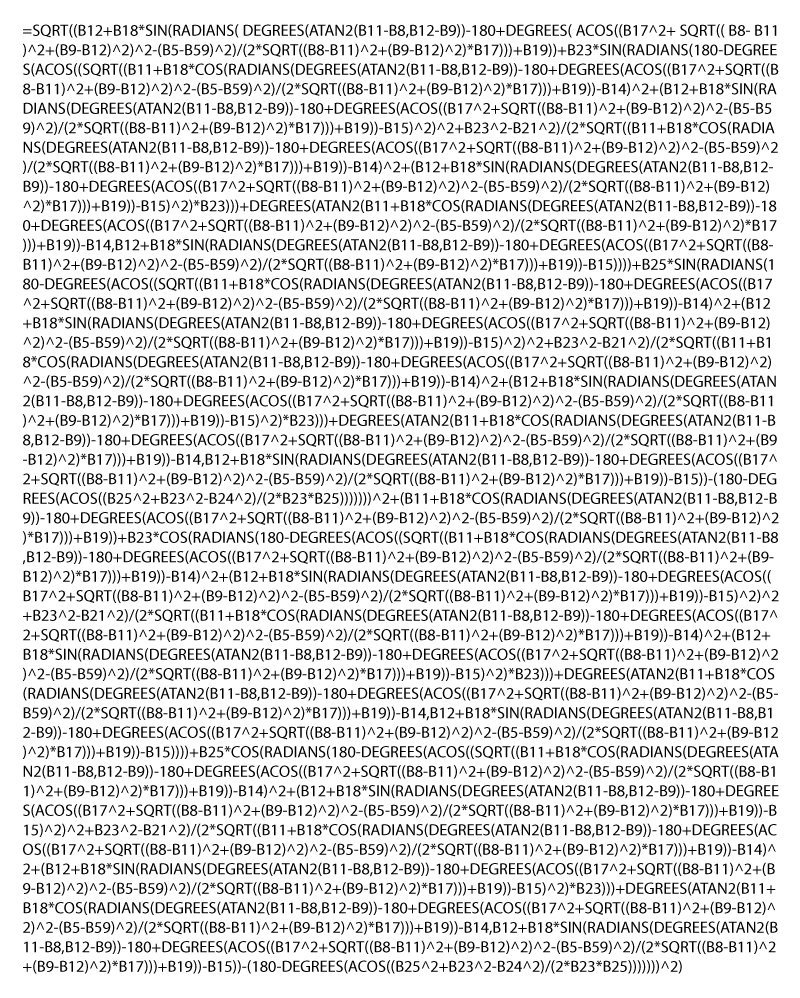
For those curious about what the math actually looks like behind these calculations, here is the formula for the calculation of the rear center of the system at a given shock compression. It’s wild stuff.