
Ok. The winner is the winner and second place is the first loser. We learned that a long time ago.
Have you looked any deeper into your race results? Were you actually “mid-pack”? A top rider? Shitty? Sure, you can see what order you came in but knowing more about the race isn’t often discussed. There’s a lot to learn that few talk about.
Here’s a chart I made that shows all 200 men finishers in the 2018 Downieville DH segment of the All-Mountain competition. I put all the male riders in the mix as the course was the same for everyone and this increases the sample. It also moves riders to their true place in the race regardless of what class they were entered in.
Then, model over those results with cumulative and probability gamma curves. This smooths things out and give us some nice info.
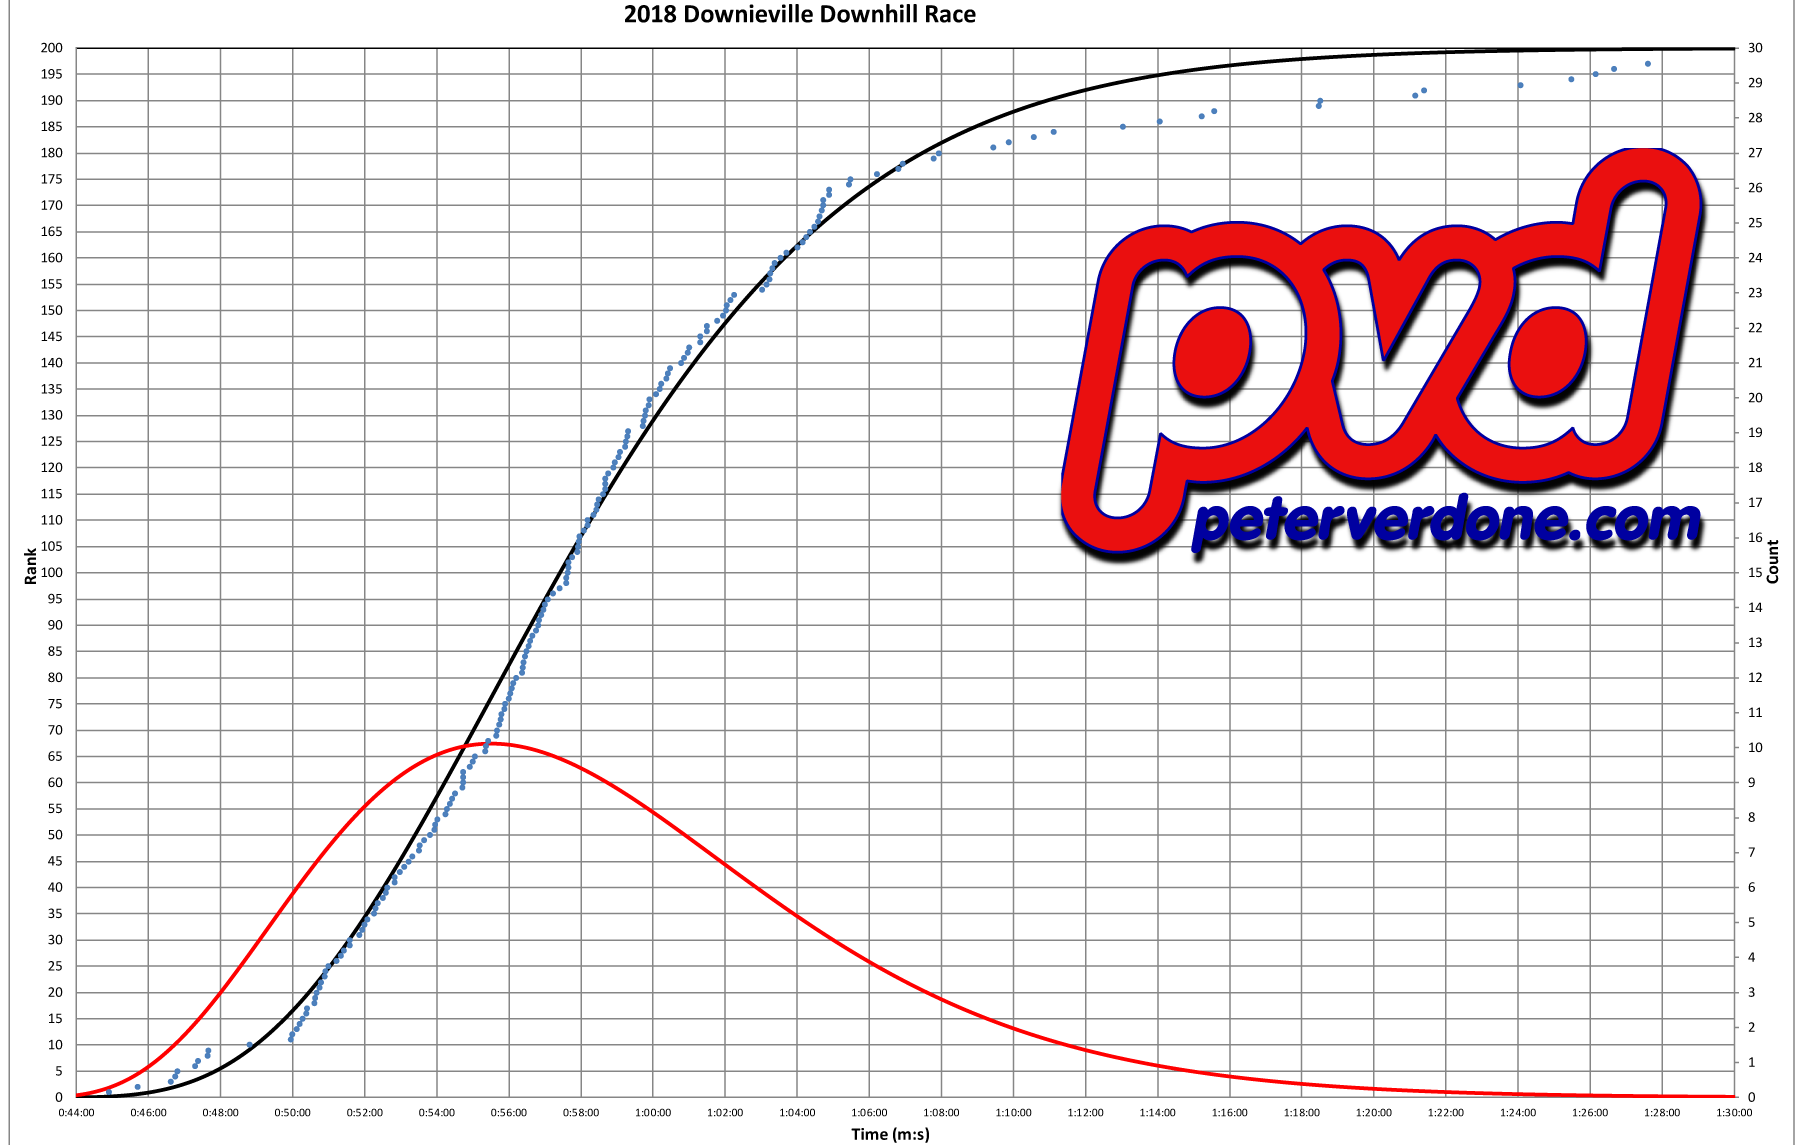
What can we see? Well, The first thing that we learn is that the top ten fastest riders were in a whole different race than anyone else with the winner, Geoff Kabush, on another level. Other riders were just improving on one another. The top ten, were doing something very different. What? Probably everything.
Riders that had an overall time faster than 55:00 had more working for them than against. 65 riders were in this group. 32.5% of the field. This is the skew. There is no normal distribution in the real world and races are a self selecting population. Certainly, a rider that took over 1:06:00 to complete the course was horrible. Either a complete mechanical failure or an abject misunderstanding of what the racing a mountain bike entails.
Race classes are useful and important, as long as folks are entered in the correct class. Having riders of similar speeds grouped in the right order will help a race go smoothly and well for everyone involved. Faster riders behind slower riders will always create problems and get in the way of a fair measure of skill. Looking at data as I lay it out can help riders understand the actual class they should have been entered in. Information that will help their entry in the next race.
Let’s compare this to the last round Enduro World Series #5, in La Thuile, Italy.
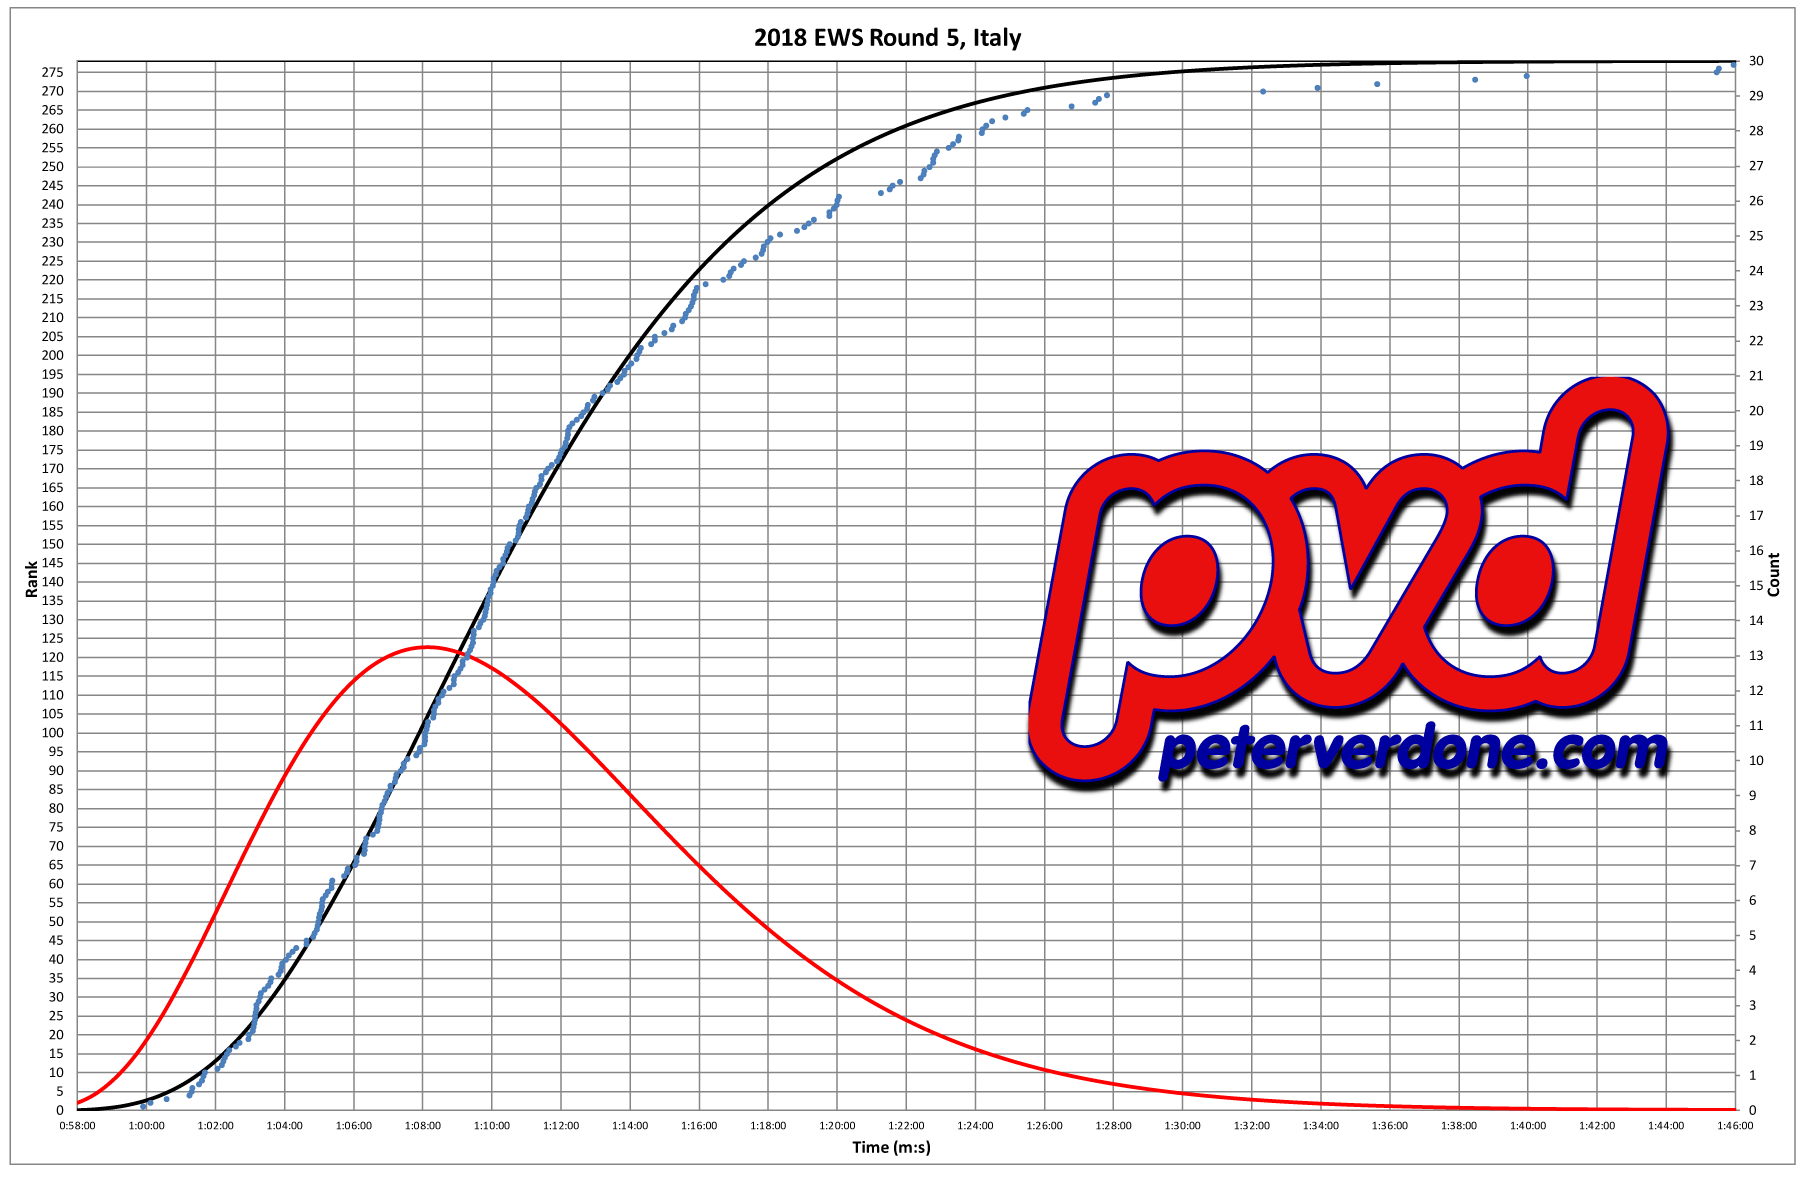 This is a list of the 278 male riders with the slowest rider left off the graphic as he was 1/2 hour slower than the second to last finisher.
Here, we see that Samuel Hill, Martin Maes, Eddie Masters are doing something very different than even the other top pro riders. Rather than just improving on what the other riders were doing, these riders were playing a different game. Not as dramatically as the top riders at Downieville, but that would be expected as this is a world level competition rather than a regional event.
Riders that had an overall time faster than 1:08:00 had more working for them than against. 96 riders were in that group. 34.% of the field. Riders that took over 1:20:00 really shouldn’t have been involved in this level of competition.
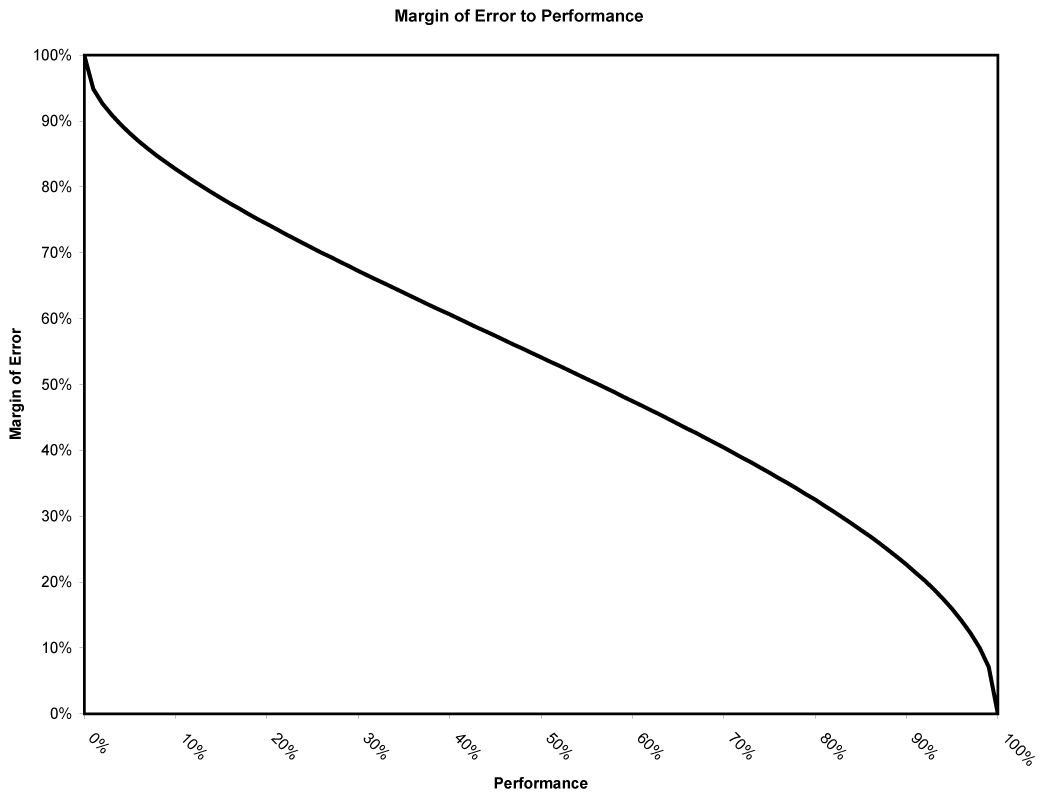
Of course, we’re looking at margins of error in results or the point of diminishing returns. Getting things perfect is almost as hard as screwing up entirely. Before I had even learned the statistical background on this subject or collected data, I had made this graphic (2006?). It needs updating to include the skew where it is so difficult to do everything right but so many ways and grades of screwing up.
This all helps us know that the order of your results doesn’t teach you a whole lot. What does is knowing where you are on the curve and what makes someone a real hero or zero.